The use of charts is the most important thing in monitoring the price movements of various assets on financial markets, including to monitor the exchange rate in forex trading. All types of forex analysis, both technical and fundamental, will use charts to assess current market conditions while compiling projections of future price movements. Therefore, forex traders must know the various types of charts that are commonly used, so they can choose which one is most suitable for trading activities.
Types of Forex Charts
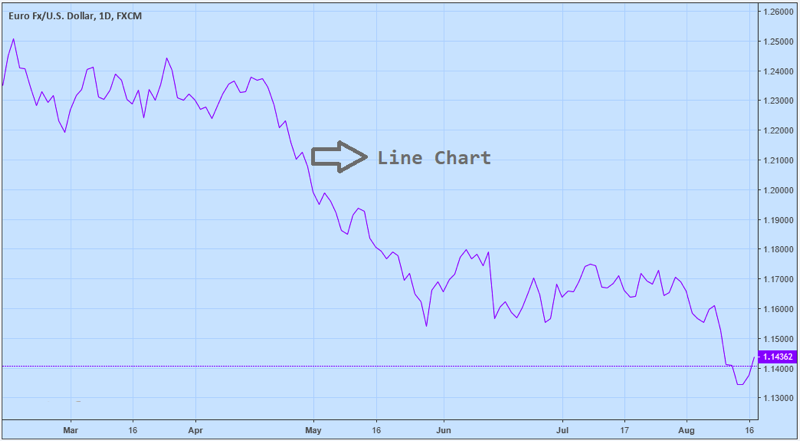
1. Line Chart
Line Chart is the simplest type of forex chart formed by drawing a line from one closing price (Close) to the next closing price. If it is arranged continuously, then we can see the price movements as shown in the following picture.
2. Bar Chart
Unlike the Line Chart which only contains the closing price information (Close), the type of the Bar chart also calculates the opening price (Open), as well as the dynamics of the highest (High) price and the lowest (Low). Therefore, Bar Charts are often also called OHLC charts (Open, High, Low, Close).
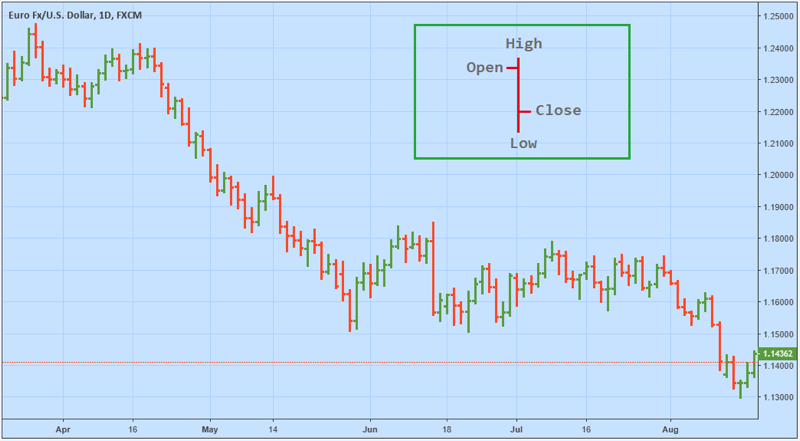
The stroke on the left side of the bar represents the opening price, while the stroke on the right shows the closing price. The bottom of the stem shows the lowest price, while the upper part represents the highest price, in a certain time period. The time period can vary according to the timeframe chosen by the trader, can be in 5 minutes, 10 minutes, 15 minutes, 1 hour, 1 day, up to 1 month.
3. Candlestick Chart
The Candlestick chart type contains detailed price information for the same period as the Bar chart, but the format is more beautiful and readable. OHLC is displayed in the form of a candle, with an axis made of High and Low, while the candle rod represents the difference between Open and Close prices.
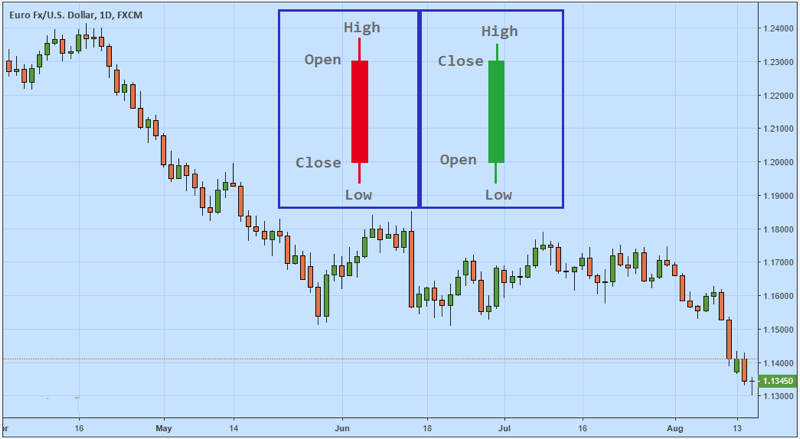
When the Open price is higher than the Close price, it means a decline, so that a Bearish candle is formed. Whereas if the Open price is lower than the Close price, it means that there is an increase, so the Bullish candle is formed (colored green).
The Best Types of Charts for Forex Analysis
Among the three types of forex charts, the majority of traders use Candlestick charts, because the information is complete and easy to read. In addition, candlestick charts can form a formation of candlestick patterns that indicate a turning point in price movements, so it is often considered a high-accuracy trading signal.
Not all forex trading platforms install candlestick charts as the default chart. If the chart on your platform is still in the form of a Line Chart or Chart Bar, then just change it to Candlestick manually. Usually an option is available to change the type of chart on the menu bar row. You can also modify the Bullish and Bearish candle colors yourself, not necessarily green and red.