In forex trading, the formed price actually follows the buy-sell mechanism in the market. Therefore, there are certain levels that are indirectly agreed upon by traders as a price reversal point, ie when the selling power weakens (while the purchasing power strengthens) or when the purchasing power weakens (while the selling power strengthens). These price reversal points are called Support and Resistance in forex. Here’s the full review.
Understanding Support – Resistance in Forex
When traders already assume the current price level is too high, they will tend to end the buy action by taking profit-taking. This action causes prices to fall after reaching a certain high level, which is then referred to as Resistance in forex.
Conversely, there is a price level that traders consider low enough, so those who sell will take profit. As a result, prices will be corrected up. This is the forerunner of Support.
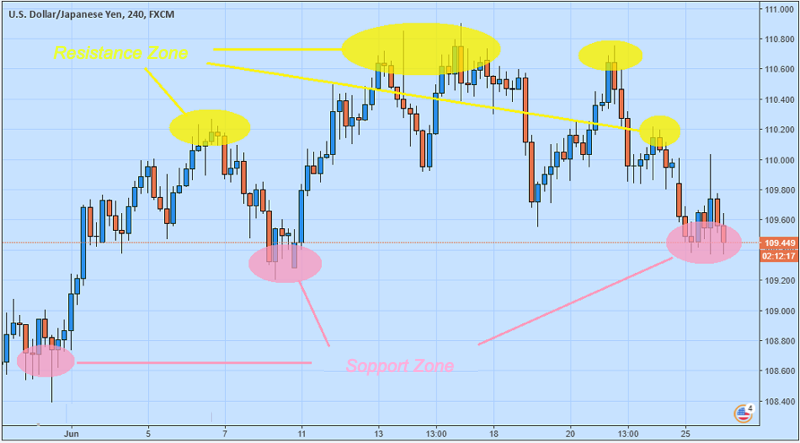
For more details, try to consider the example of Support – Resistance on the following USD / JPY chart:
You may have heard the quote “buy when the price is low, sell when the price is high” (buy low, sell high). However, beginner forex traders are often confused about where low prices and high prices are located. Well, Support – Resistance in forex is the answer.
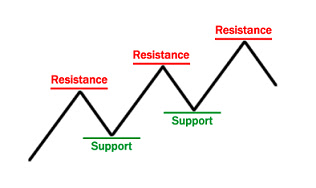
Resistance is the area created when the price stops rising, then turns down. Resistance acts as the “upper limit” which prevents further price increases for a while. Whereas Support is an area that is created when prices stop declining, then turn up. Support becomes a “lower limit” which prevents prices from declining further for the time being.
If we can find the Support points – Resistance, then we can know, when to buy, when to sell, and when to take profit. However, how to identify Support – Resistance is not as simple as just seeing the highest and lowest prices.
How to Determine Support – Resistance
There are various ways to determine Support – Resistance in forex. The most common way to do this is to look at the highest and lowest levels on the price chart, as shown in the example above. However, forex traders also often use the help of technical indicators or methods of mapping certain price movements. Here are a few examples:
1. Determine Support – Resistance Using Bollinger Bands (BB)
Bollinger Bands indicators can be found on all trading platforms provided by forex brokers. The trick, on the trading platform, open the price chart of the currency pair you want to trade, then insert the Bollinger Bands indicator. Later two lines of Bollinger Bands will appear on the graph like two bands flanking price movements.
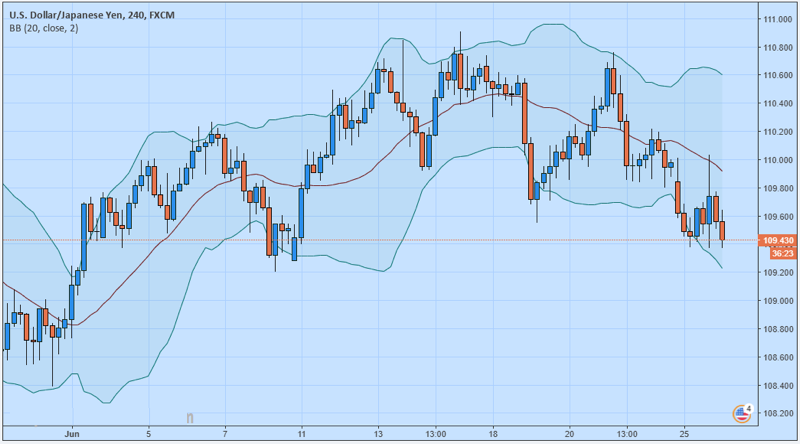
Notice how prices tend to turn down after reaching the upper limit of the BB (Resistance), then turn up after reaching the lower limit of BB (Support). The lower limit and the upper limit appear to be volatile, so it is also called Support – Dynamic resistance.
2. Determine Support – Resistance With Pivot Points
Pivot Points are Support points – Resistance calculated based on the highest price (High), lowest price (Low), and market closing price (Close) in the previous period. Calculation formula for Pivot Points:
Pivot Point (PP) = (High + Low + Close) / 3
Support Level – Resistance is then determined as follows:
First support (S1) = (2 * PP) – High
Second support (S2) = PP – (High – Low)
First resistance (R1) = (2 * PP) – Low
Second resistance (R2) = PP + (High – Low)
You can calculate Pivot Points manually. However, actually you don’t have to use the formula and calculate it yourself. If you understand the Pivot formula, it will be better, but usually in the trading platform indicators are available to automatically determine the pivot.
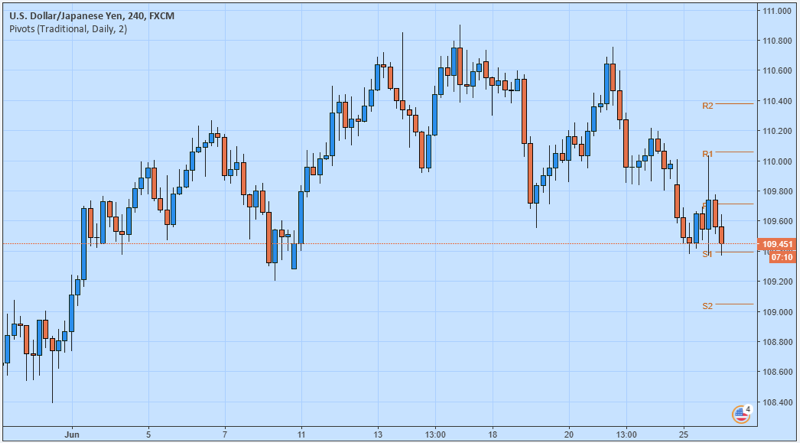
Observe the lines with the letters R2, R1, P, S1, and S2 on the left side of the chart. That is Support – Resistance which is determined by calculating Pivot Points. After turning at the Pivot point (P) , the price moves towards S1. If later the price drops again, it is likely to reach S2. Whereas if the price turns up, it can return to the Pivot point again. When trading, R2, R1, P, S1, and S2 can be used as a reference for opening trading positions (open position / entry), profit targets, as well as maximum loss limits (Stop Loss); because at those points the price reversal is most likely to occur.